Without the right insights into your marketing and sales data, it’s near impossible to run an efficient revenue engine. Getting the right insights means tracking the right metrics. And without accurate data, it’s difficult if not impossible to make smart decisions.
In this blog post, I’ll share how AK Operations approaches goal planning and reporting to provide our clients with actionable insights that help them close more deals, faster.
Goal Planning
Goal planning is a crucial part of running a revenue engine, a system of marketing and sales processes that drive consistent, predictable revenue. By setting metric-based goals on a monthly and quarterly basis, you create benchmarks for success that allow you to hold yourself and your team accountable.
Here are some important things to consider before committing to a number:
- What is your total addressable market (TAM)? Do you have enough fuel to feed the funnel? At AK Ops, we define fuel as people in the TAM that we can contact.
- What is your email database and does it need to be cleansed? Do you need to run a list of emails through ZeroBounce before we use them?
- What is your fuel budget? Can you afford a list source like Apollo or ZoomInfo?
- Do you have enough sales seats in HubSpot to sequence this number of contacts? Each sales seat can safely send between 350-750 emails a day.
At AK Operations, we structure our revenue engine with goal conversion rates that we’ve discovered and tested over time. Conversion rates are calculated by finding the percentage of contacts/deals that advance down the pipeline from one milestone to the next. Milestones include marketing qualified lead (MQL), sales accepted lead (SAL), sales qualified lead (SQL), and closed won. We use conversion ratios to highlight the health of your marketing and sales as well as the pipeline you’re building.
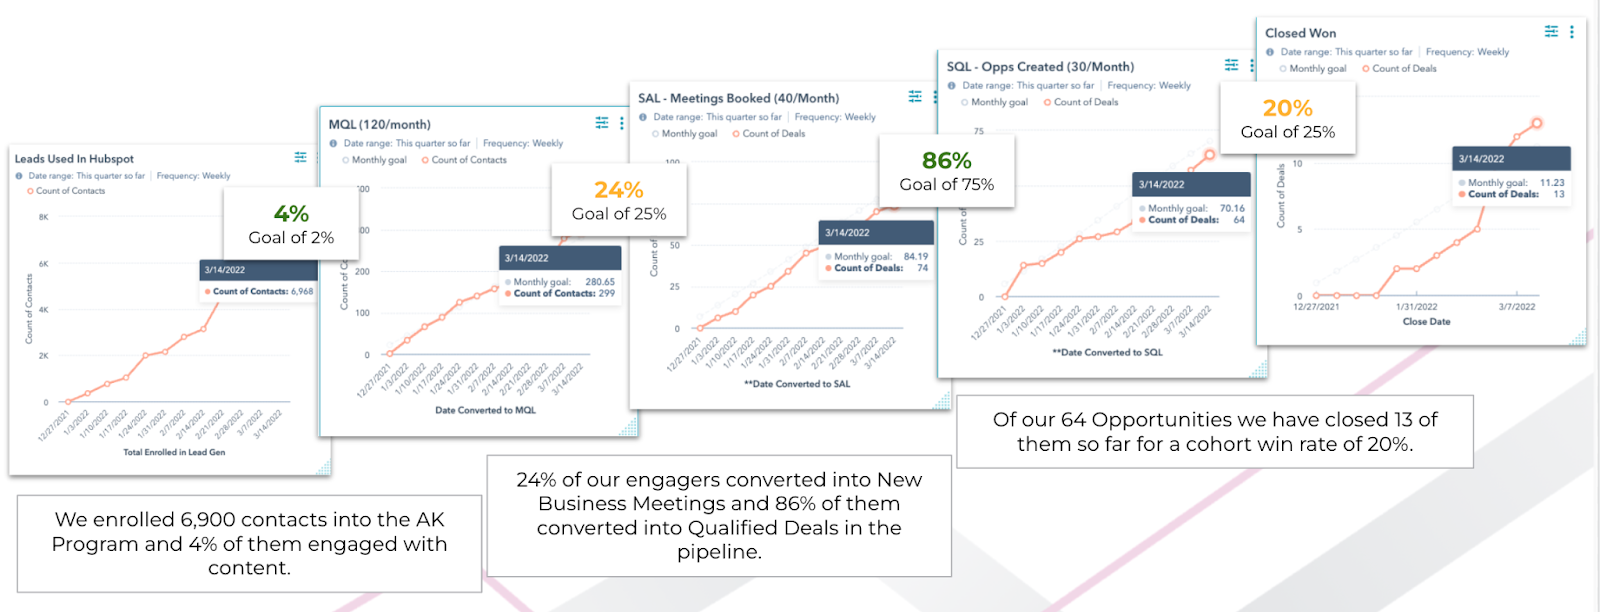
Follow the math and the visual below to gain a better understanding of how conversion ratios are calculated.

Active in Lead Gen → MQL = MQLs / Total Active in Lead Gen
299/6,968 = 4%
MQL → SAL = SAL / MQLs
74 / 299 = 24%
SAL → SQL = SQL / SAL
64/74 = 86%
SQL → Wins = Wins / Opportunities
13/64 = 20%
Key Reports
Once you’ve set your goals on a monthly and quarterly basis, it’s time to build the HubSpot reports that will help you monitor your progress on a daily basis.
The AK Ops team has identified five crucial reports that will make up a HubSpot dashboard we call the Monthly Tracking Dashboard. A dashboard in HubSpot is a single view that contains related reports. Following our AK Program, once we turn on all our workflows that automate our marketing and sales operations and update our data, the Monthly Tracking Dashboard is live and always accurate—there’s no need to manually update it!
The five reports are:
- Leads Active in Lead Gen
- MQLs
- Meetings Booked (SALs)
- SQLs
- Closed Won
Using Your Reports to Gain Strategic Insights
A fatal mistake is building solid reports but never using them to drive strategic decision-making. We see far too many companies falling into this trap, only referring to their reports at the end of the month or quarter to see how they did.
That’s why we stress the importance of understanding the trend lines in your reports. You should easily be able to know where you’re currently at and how much you still need to go in order to hit your goals.
Another critical part of gaining strategic insights is ensuring you have one source of truth. Everyone on your team should be looking in the same exact place to get data, not a bunch of different reports with slightly different numbers. This is one of the biggest advantages to the AK Program’s Monthly Tracking Dashboard: since our workflows automatically update the dashboard in real-time, there’s no need to mine through the data and manually update the reports.
Case Study: Using Reports to Pivot Pipeline Focus for an Early Education Assessment Client
From 2021 to 2022, with the addition of our program, as well as other meeting sources, one of our AK Operations Clients increased their Meetings Booked by 110%.
One might assume that this increase in Meetings Booked should have led to a significant increase in Wins, but the year actually ended with a 19% decrease in Won deals. So what happened?
By looking at the client’s revenue engine on a weekly basis, we identified a gap from Qualified Demos to Contracting, two key stages in the client’s deal pipeline. Although conversion rates from Meetings Booked to Qualified Demos increased, the conversion rates from Qualified Demos to Contracting significantly decreased, leading to an overall decrease in Won deals.
With a lean sales team like our client, there were actually too many meetings booked. Our client’s sales team wasn’t able to give their pipeline the time and attention they needed to move opportunities forward. By identifying this issue with accurate and updated reporting, we were able to redirect our time and energy from booking meetings to moving prospects to the contracting stage.
Book More Meetings with Automation and our Strategic Approach
Our mission is to make sales more collaborative, data-driven, and scalable. When sales organizations are built around healthy processes, rep-enabled campaigns, and monitored KPIs, our top funnel program produces consistent sales opportunities—ultimately building more pipeline with better conversion rates. After weeks of pivots and continuous improvement, the AK Program performs almost completely on autopilot, requiring only ongoing management and fresh campaigns that sustain companies forever.
